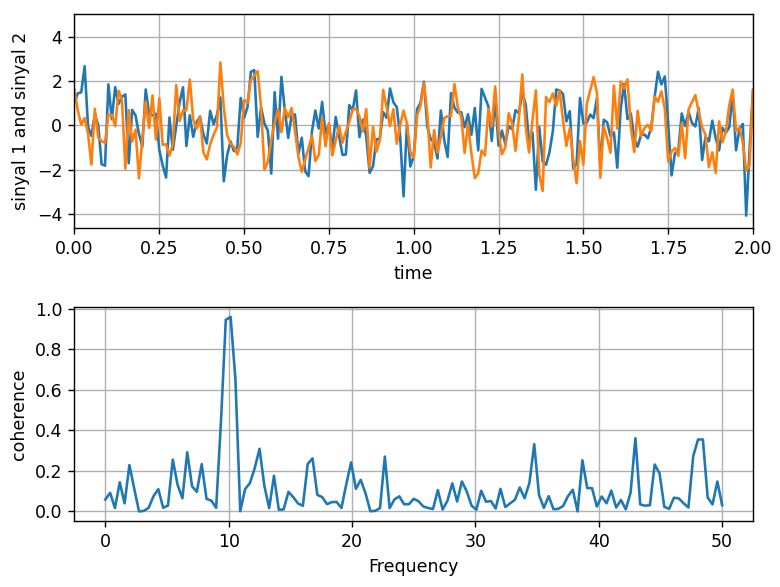
Berikut adalah kodingan dasar untuk mem-plot sinyal dan frekuensi pada Python menggunakan Matplotlib dan hasilnya akan seperti gambar berikut :
import numpy as np
import matplotlib.pyplot as plt

# Fixing random state for reproducibility
np.random.seed(19680801)

dt = 0.01
t = np.arange(0, 30, dt)
nse1 = np.random.randn(len(t))                 # white noise 1
nse2 = np.random.randn(len(t))                 # white noise 2

# Two signals with a coherent part at 10Hz and a random part
s1 = np.sin(2 * np.pi * 10 * t) + nse1
s2 = np.sin(2 * np.pi * 10 * t) + nse2

fig, axs = plt.subplots(2, 1)
axs[0].plot(t, s1, t, s2)
axs[0].set_xlim(0, 2)
axs[0].set_xlabel('waktu')
axs[0].set_ylabel('sinyal 1 and sinyal 2')
axs[0].grid(True)

cxy, f = axs[1].cohere(s1, s2, 256, 1. / dt)
axs[1].set_ylabel('frekuensi')

fig.tight_layout()
plt.show()